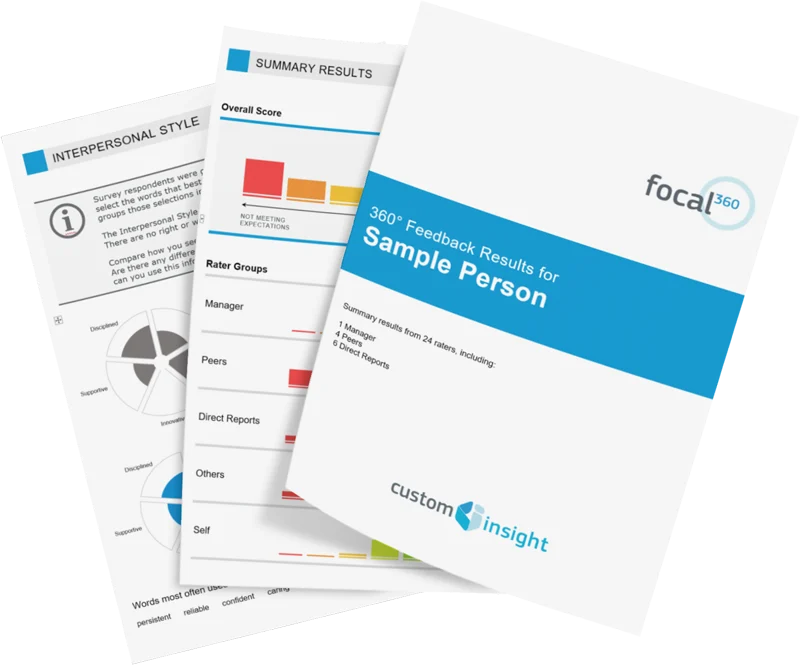
Sample 360 Degree Feedback Reports

We are especially proud of our reports. They have been carefully designed to be clear, focused, and easy to understand. No PhD or special training is required to interpret the results.
Moreover, the professional quality of the reports adds credibility to the results and makes you look good.
Three different types of reports are available:
Three different types of reports are available:
- Individual Feedback Report
- Group/Team Report (combined results for groups or teams)
- Improvement/Gap Report (for repeat feedback)
Pixel-perfect report design
Clear, focused, easy to understand
Customizable report content
Automated report delivery
Clear, focused, easy to understand
Customizable report content
Automated report delivery
For samples of any of our 360 reports, please contact us
Individual Feedback Report
This is the "regular" report that each feedback recipient gets. Feedback results can be presented as raw scores or as standardized T-Scores (or both). The standardized scores allow the person to see how he/she compares to other managers and leaders across a broad range of organizations. The program administrator can generate reports on demand, and also have reports generated automatically and delivered via email.
Typical Report Contents: (Customizable - you decide which report components to include.)
- Two-factor leadership profile - based on statistical analysis; provides a high-level overview of leadership style and effectiveness
- Category scores - overall and by rater group
- Category breakdowns - scores on individual items within each category
- Highest and lowest rated items
- Manager disagreements and blind spots - highlighting significant gaps between rater groups
- Written comments
- Frequency distributions for all items
Group/Team Report
The group report combines the feedback results from any selected list of feedback recipients. The report highlights overall strengths and weaknesses of the selected group, and it also shows the relative scores of the people within the group. As with all of our reports, the group report is provided as a word document, so any pages with sensitive information can be easily removed before sharing the results with others.
Report Contents:
- Two-factor leadership profile - individuals and group average presented as a scatter plot diagram
- Top skills - highest average item scores for the entire group
- Top development needs - lowest average item scores for the entire group
- Individual category scores - compares category-level results for each person in the group
Improvement/Gap Report
This report is only for people who are receiving feedback a second time. The report highlights the biggest increases and decreases in scores, including overall changes as well as changes from each rater group. The gap report helps individuals and other stakeholders see whether efforts to make changes have been successful.
