Employee engagement surveys and employee satisfaction surveys work a lot like personality assessments. Both are developed and statistically validated in more or less the same way, and both rely on benchmark (normative) data to determine whether scores are high or low.
If you needed a personality assessment, it is unlikely that you would consider creating your own from scratch. The idea of doing so probably seems absurd to most people. Equally absurd would be to identify an existing personality assessment, but then suggest that you would like to change the wording of a few items or remove items that you don't like.
Creating your own employee engagement is an equally bad idea. You might easily get beyond the initial challenge of item quality by using a list of items that have already been statistically validated, but without benchmark data, you won't be able to draw any conclusions from your results.
The importance of benchmarking on an employee engagement or satisfaction survey has very little to do with the types of companies (industry, size, etc) that the benchmarks are based on. Geography is relevant in the broadest sense - across countries or regions where cultural norms are different. But aside from this, the importance of benchmarking is all about the specific items themselves.
Benchmarking works a lot like a handicap in golf. Amateur golfers with different skill levels have different handicaps. When golfers play against one another, each person's final score is adjusted by his or her handicap. This allows players with different levels of proficiency to play against each other on somewhat equal terms.
Every item in an employee survey has its own natural "behavior". Some items tend to get higher scores and some items tend to get lower scores. This can be due to the way the item is worded or it can have to do with the topic that the item addresses - or both. Benchmarking eliminates these natural differences between items, thereby allowing you to compare scores across items. Benchmarking also tells you whether those scores are high or low.
Consider the following two items:If you needed a personality assessment, it is unlikely that you would consider creating your own from scratch. The idea of doing so probably seems absurd to most people. Equally absurd would be to identify an existing personality assessment, but then suggest that you would like to change the wording of a few items or remove items that you don't like.
Creating your own employee engagement is an equally bad idea. You might easily get beyond the initial challenge of item quality by using a list of items that have already been statistically validated, but without benchmark data, you won't be able to draw any conclusions from your results.
The importance of benchmarking on an employee engagement or satisfaction survey has very little to do with the types of companies (industry, size, etc) that the benchmarks are based on. Geography is relevant in the broadest sense - across countries or regions where cultural norms are different. But aside from this, the importance of benchmarking is all about the specific items themselves.
Benchmarking works a lot like a handicap in golf. Amateur golfers with different skill levels have different handicaps. When golfers play against one another, each person's final score is adjusted by his or her handicap. This allows players with different levels of proficiency to play against each other on somewhat equal terms.
Every item in an employee survey has its own natural "behavior". Some items tend to get higher scores and some items tend to get lower scores. This can be due to the way the item is worded or it can have to do with the topic that the item addresses - or both. Benchmarking eliminates these natural differences between items, thereby allowing you to compare scores across items. Benchmarking also tells you whether those scores are high or low.
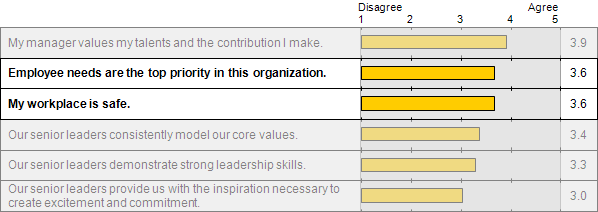
"Employee needs are the top priority in this organization."
Benchmark Average Score: 3.1; Standard Deviation: 0.4
"My workplace is safe."
Benchmark Average Score: 4.1; Standard Deviation: 0.4
Now, assume you conducted your own employee survey, and your results show that you scored a 3.6 on both of these items. What can you do with that information? What do these scores tell you?

You would probably start by assuming that you are doing equally well or poorly in both areas. You might decide whether the scores are good or bad based on the scores you received on all other items in the survey, or you might decide that the score was above 3.0 in both cases, so you must at least be doing OK in both areas.
However, if you apply the benchmark (normative) data, you discover that you are actually doing very well in one area and very poorly in the other. With an average raw score of 3.6 on both items, the first item would have a T-Score of 63 (89th percentile) and the second item would have a T-Score of 37 (11th percentile). In other words, employee needs are definitely the top priority, but they are working in a very dangerous environment.

To understand more about how T-Scores work, click here.
It might sound like an overstatement, but creating and conducting an employee engagement or satisfaction survey on your own can be worse than doing nothing. At best, you will have a lot of wasted effort that will reflect poorly on HR and company leadership. At worst, you may draw incorrect conclusions from your results and take action based on those incorrect conclusions. Employees will feel that they took the time to tell you what they are thinking, and your response could overlook the most relevant and important issues.
Popular Employee Engagement Article Topics and Resources:
- What is Employee Engagement?
- Employee Satisfaction vs. Employee Engagement
- Sample Employee Survey Questions
- Employee Engagement Dashboard Examples
