If you want industry-specific benchmarks for your employee survey, you probably already understand that benchmark data are important, but you may not fully appreciate why and how benchmarks are critical.
The primary purpose of benchmark data is NOT to compare your organization to other similar organizations. For the most part, benchmarking on an employee engagement survey has relatively little to do with the types of companies that the benchmarks are based on.
Benchmarking works a lot like a handicap in golf. Amateur golfers with different skill levels have different handicaps. When golfers play against one another, each person's final score is adjusted by his or her handicap. This allows players with different skill levels to play against each other on equal terms, and to determine winners and losers not on an absolute basis, but rather, on an adjusted basis that accounts for each person's skill level.
Every item in an employee survey has its own natural "behavior" or "handicap". Some items tend to get higher scores and some items tend to get lower scores. This can be due to the way an item is worded or it can have to do with the topic that the item addresses - or both. Benchmarking eliminates these natural differences between items, which allows you to compare scores across items. Benchmarking also tells you whether those scores are high or low.
Read a more detailed explanation and see examples here
Comparing Industries
From a high-level perspective, the differences in benchmark data across industries are generally quite small compared to the differences between different companies, as illustrated in the two charts below.
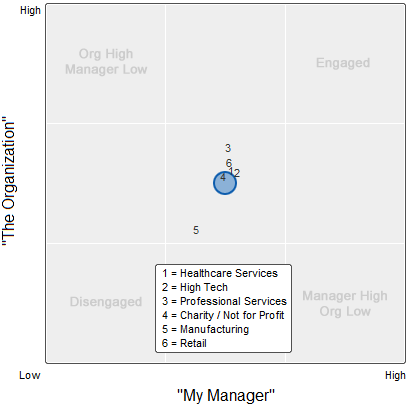
The first chart shows how different industries score on the two primary factors of engagement - Engagement with the Organization and Engagement with "My Manager". The blue circle is the average of all companies.
What is notable about this chart is how unremarkable most of the industry differences are. The obvious exception is Manufacturing (more on that below).
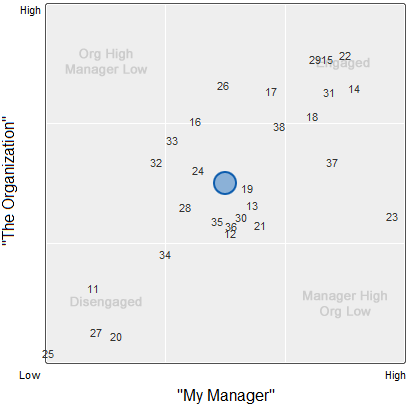
The second chart shows how individual companies within a single industry compare to one another. Each number on this chart is a different high-tech company.
Now those slight differences between industries (first chart above) start to look pretty insignificant. Even manufacturing, which stands out in the first chart, would get lumped in somewhere close to the middle if we placed it on the second chart.
In other words, when we look at the big picture, industry differences just don't matter very much. If engagement in an organization is high, low, or somewhere in between, it will show up that way regardless of whether we use global benchmarks or industry-specific benchmarks. Sure, there might be a few borderline cases near the center that will tip slightly above or below average based on which benchmarks are used, but the primary takeaway in either case will still be, "about average".
Industry Differences by Item
The high-level view of engagement illustrated above shows relatively little difference across industries, but our research shows that there are actually some industry differences when we look at specific survey questions. These differences are typically limited to a handful of questions that reflect the unique cultural aspects of those industries.
When we do identify industry differences on specific survey questions, we have to consider whether it makes sense to use industry-specific benchmarks instead of broader benchmarks that span all industries. Ultimately, this becomes a philosophical question: Should we adjust the bar in those areas where an industry scores higher or lower?
Consider the example below, which shows the largest differences for the health care industry (i.e. hospitals and medical clinics).
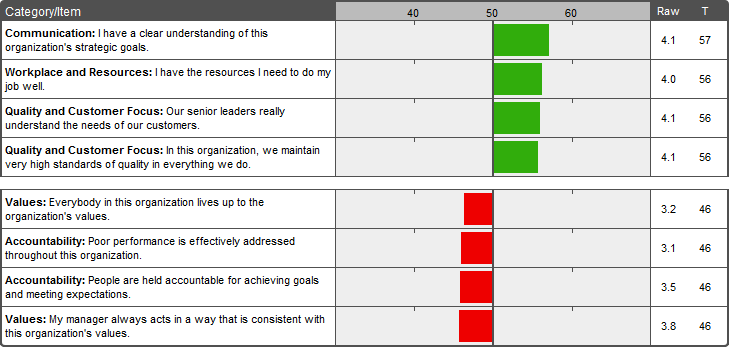
It makes sense that people in the healthcare industry have a clear understanding of their organizations' strategic goals (healing sick people, for example). We can all be thankful that "quality and customer focus" are priorities in the healthcare industry, and that the people in this industry seem to have better than average resources to do their jobs.
We can also be concerned that there seems to be some lack of accountability within the healthcare industry and that there is inconsistency in living up to organizational values.
Now imagine you are the leader of a health care organization. What information is relevant to you? Do you want to be compared to other organizations in your industry, or do you want to look at the bigger picture?
If you choose industry benchmarks, you automatically raise or lower the bar, depending on the area in question. For the items that have higher industry benchmarks, is your goal to be even more quality and customer focused than others in your industry, or is your goal simply to be quality and customer focused?
Let's assume that quality and customer focus are priorities for your organization, and let's assume that these things cost money. If your reference point is the already-high industry benchmark and your score is about average or maybe even a bit below average compared to this benchmark, is it possible that you might end up focusing resources in these areas at the expense of other areas where those resources might be put to better use?
For the items that have a lower industry benchmark the philosophical question has a darker side - do you really want to lower the bar in areas such as "values" and "accountability" just because it might be a bit of a problem throughout your industry?
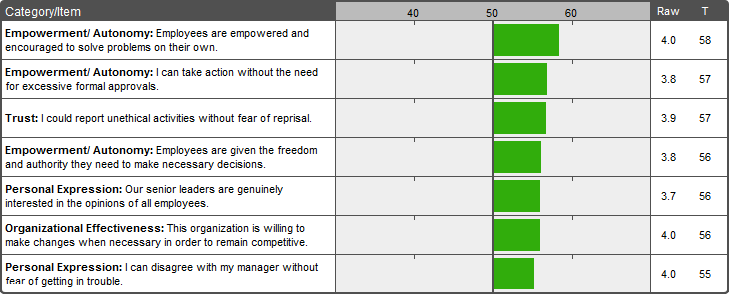
The next example is a bit less ominous, but it raises the same kinds of questions. These are benchmarks for the high-tech industry (i.e. internet and software companies). It appears that some cliches hold true within this industry - high-tech employees are much more empowered and have more freedom of expression compared to employees in other industries.
(What we haven't shown here are the 80% of items where the industry and global benchmarks are essentially the same.)
Using industry benchmarks, if a company gets an average or slightly low score on empowerment, does this suggest that the company needs to increase the level of employee empowerment? Remember, we are talking about a score that is average or slightly below average for the high-tech industry, but quite high compared to companies in other industries. Should the leaders of this company focus on increasing employee empowerment, or should they spend their time working on other areas? If a company scores high on empowerment compared to other high-tech companies, is that even a good thing? When does this become too much of a good thing?
There is no absolute right or wrong answer to these questions. There are good reasons for wanting to know how a company compares to other companies in the same industry, and there are good reasons for sticking with the global benchmarks that span all industries.
We generally come down on the side of global benchmarks for the following reasons:
- Global benchmarks are a more accurate reflection of an item's natural behavior. They are not tainted by the cultural idiosyncrasies of specific industries.
- Global benchmarks allow the results to reflect employee engagement as well as company culture. If we use industry benchmarks, the cultural aspect of the data is mostly lost. The high-tech example above illustrates this. High tech companies tend to have a culture of empowerment and personal expression. Using industry benchmarks, a company that might actually have these cultural characteristics would not see them reflected in the survey results.
- Lowering the bar allows problems to persist because they go undetected. This does not benefit the organization or employees.
- Raising the bar can mask organizational strengths that also happen to be industry strengths. It can suggest to organizations that they need to push even harder in areas where they are already doing just fine, and draw their attention away from areas that could be more important.
The problem is that when organizations are given both global and industry-specific benchmarks, there is a strong temptation to choose the story that is more favorable and to discount the less favorable. Whether conscious or unconscious, having two different reference points to choose from makes it a lot easier to pick a preferred or easier path instead of what might be the harder but more relevant one.
Nevertheless, we understand that there is a case to be made for having both global and industry benchmarks, so we do provide them to our clients upon request in cases where we have sufficient data.
Are there exceptions?
There are some areas where the industry-specific benchmarks are so different from what we see in other industries that we need to take a separate look at the issues and conclusions raised above.
Manufacturing is an example of one of these industries. The industry averages are lower on every single survey item for the manufacturing industry. The highest and lowest item scores for manufacturing are shown below.
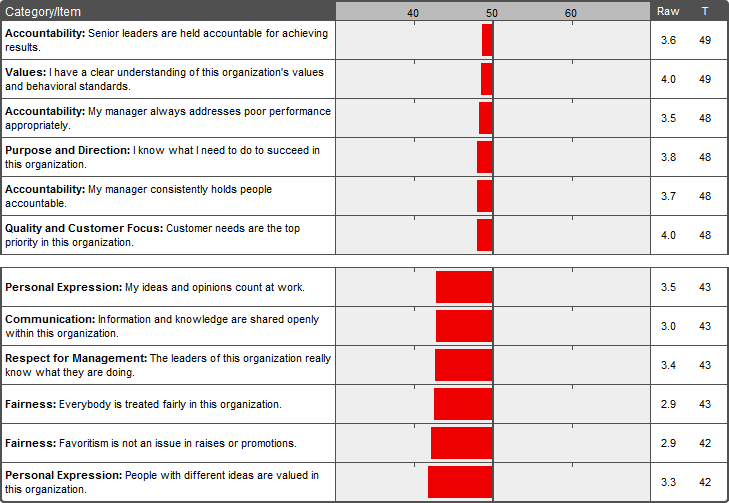
At the bottom of the list, we see that personal expression and fairness are very low. Meanwhile, at the top of the list, scores for accountability are below average compared to all industries, but they are a lot higher than most other areas.
Should we use global benchmarks here, knowing that most manufacturing companies are going to get low scores? Or should we use industry benchmarks, knowing that this means we are lowering the bar in all areas, including those very low scoring areas like personal expression and fairness?
Neither of these options is going to give us a good outcome. Global benchmarks will result in too much bad news, which makes it hard to know where to focus change efforts. Low scores are also just plain discouraging, sometimes resulting in companies choosing to discount, ignore, or rationalize the survey results - and some of this would be justified given what we know about the industry data.
On the other hand, using industry benchmarks would mean that we completely discount or ignore what appear to be industry-wide problem areas. Consider the raw score for the item "Everybody is treated fairly in this organization." At 2.9 on a 5-point scale, more people disagreed with this statement than agreed with it. In fact, 40% of manufacturing employees disagreed with this statement, while only 32% agreed - and these percentages include responses from management and senior leadership! Even if we ignore the benchmark data entirely, we can still see that there is something going on here.
The approach we use in this case is to simply adjust all the global benchmarks by the same amount so that the average score for manufacturing across all items results in a T-Score of 50. In this example, the average T-Score across all survey items was 46, so we add 4 to every T-Score. The chart below shows what this shift looks like.
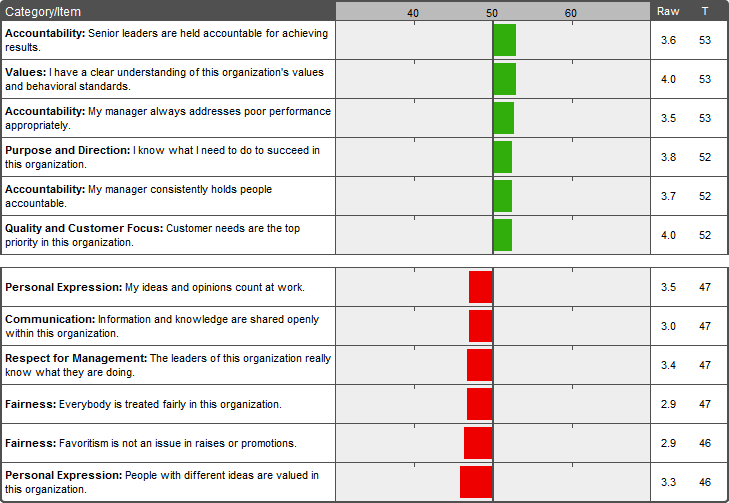
Now, most manufacturing companies score above average on accountability. They still score below average on fairness and personal expression, but not quite as low as before. If we step back and think about what assumptions we would make about this industry, these adjusted score seem to fit. In other words, it makes sense that manufacturing companies are generally good at accountability, and not so good at promoting personal expression.
Popular Employee Engagement Article Topics and Resources:
- What is Employee Engagement?
- Employee Satisfaction vs. Employee Engagement
- Sample Employee Survey Questions
- Employee Engagement Dashboard Examples